How Pulsy calculates eNPS, average and median
How Pulsy calculates the eNPS, NPS, average and median of each scale question, from promoters and detractors, and how to follow each score over time.
 SlackUpdated Oct 5, 20261 min read
Every scale question in Pulsy's survey results shows three scores: NPS, Average and Median. The NPS is the percentage of promoters minus the percentage of detractors, from -100 to 100, and the eNPS is that score on Pulsy's eNPS question.
Where eNPS comes from#
eNPS is the score of the eNPS question from the question bank: "How likely are you to recommend our company as a workplace?", on a 0 to 10 scale. Add it to any survey from the eNPS theme. There's no separate eNPS feature: Pulsy calculates an NPS for every scale question.
How the NPS is calculated#
NPS = % of promoters minus % of detractors. It goes from -100 to 100.
| Scale | Promoters | Passives | Detractors |
|---|---|---|---|
| 0 to 10 | 9 and 10 | 7 and 8 | 0 to 6 |
| 1 to 5 | 5 | 4 | 1 to 3 |
For example, with 10 answers on a 0 to 10 scale, 5 promoters and 2 detractors: 50% minus 20% gives an NPS of 30.
Average and median#
Average: the mean answer, out of 5 or out of 10 depending on the scale.Median: the middle answer once all answers are sorted.
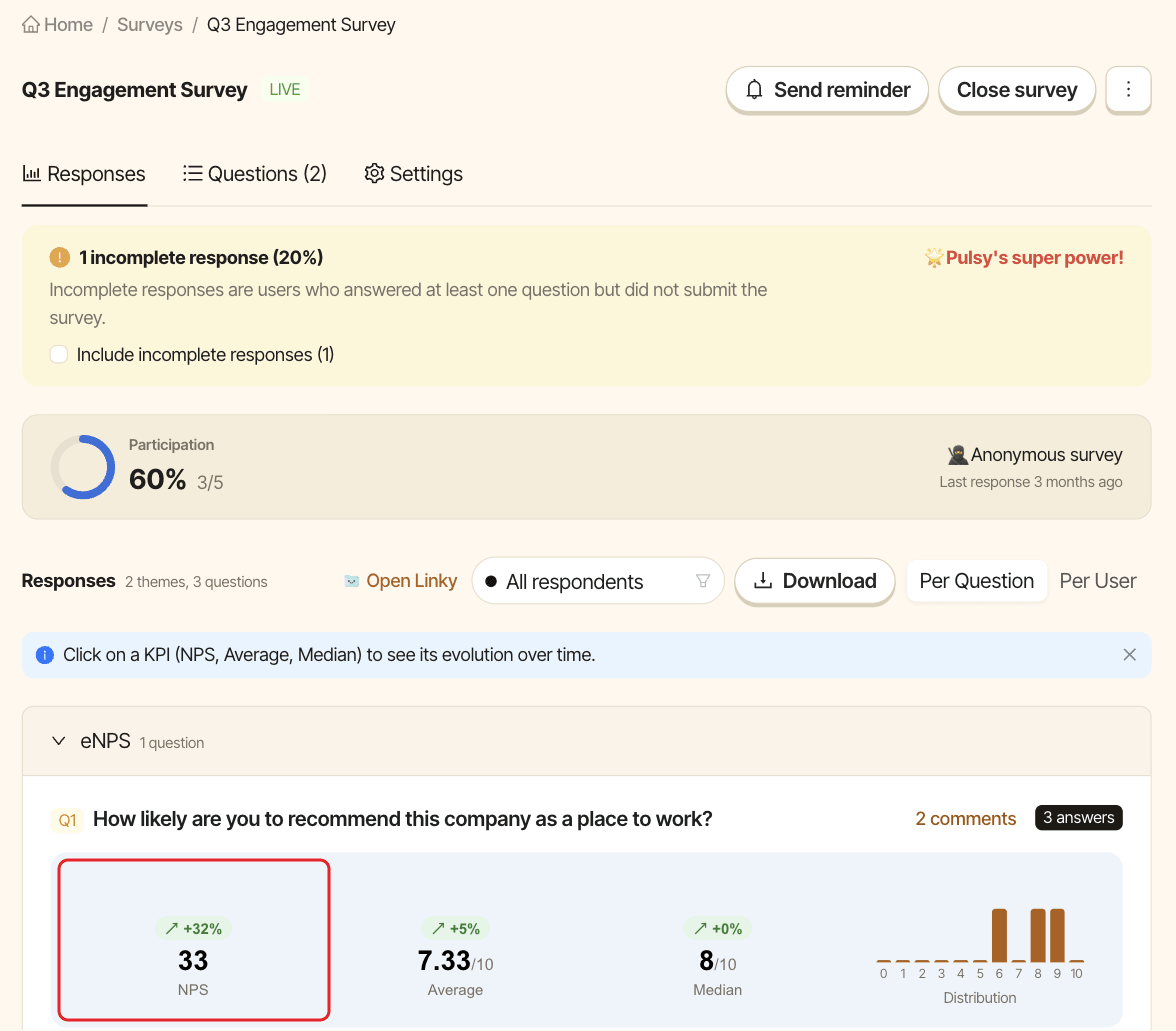
Compare with the previous survey#
Next to each score, a trend shows how much it moved, in percent, since the previous survey that asked the same question. That works for the editions of a recurring survey and for duplicated surveys, which keep the same questions.
See the evolution over time#
Click NPS, Average or Median on a question card. A chart shows that score across every survey that asked the question.
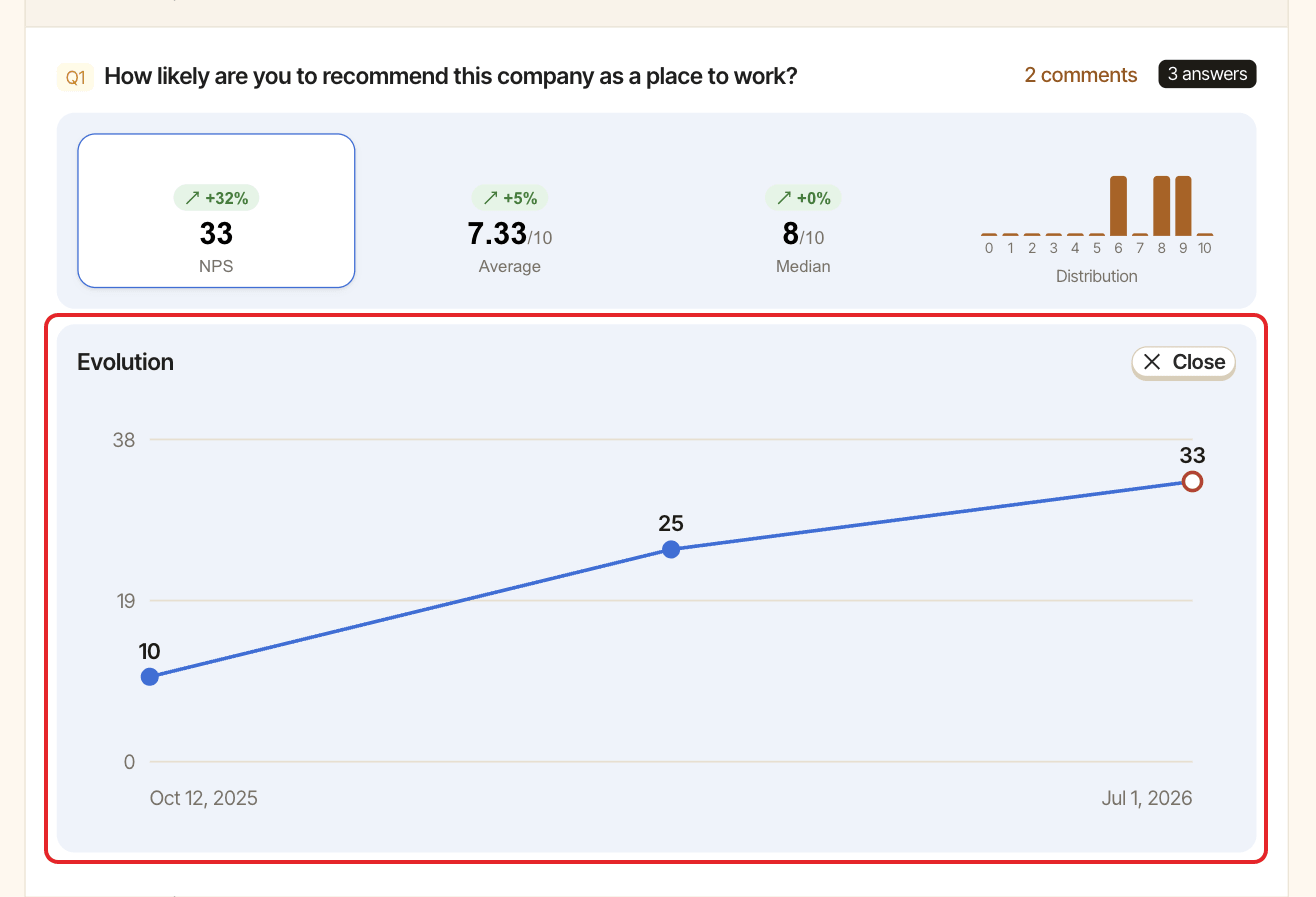
Filtering by department also filters the chart. See filter results by department.